
Dashboard Reporting KPIs
Comprehensive dashboard reporting system for tracking key performance indicators across 12 business departments
Client
Masaha Global
Year
2024
Services
Project Gallery
View Project
Design Process
The Challenge
Masaha Global needed a unified dashboard reporting system to track and monitor KPIs across 12 diverse departments including Executive Management, Rental, Sales, Power Systems, Projects, Spare Parts, Service, HR, Finance, Procurement, Logistics, and Operations & HSE. The challenge was to create a real-time monitoring solution that would increase transparency, improve reaction time to operational risks, and drive alignment between departments through a single source of information.
The Solution
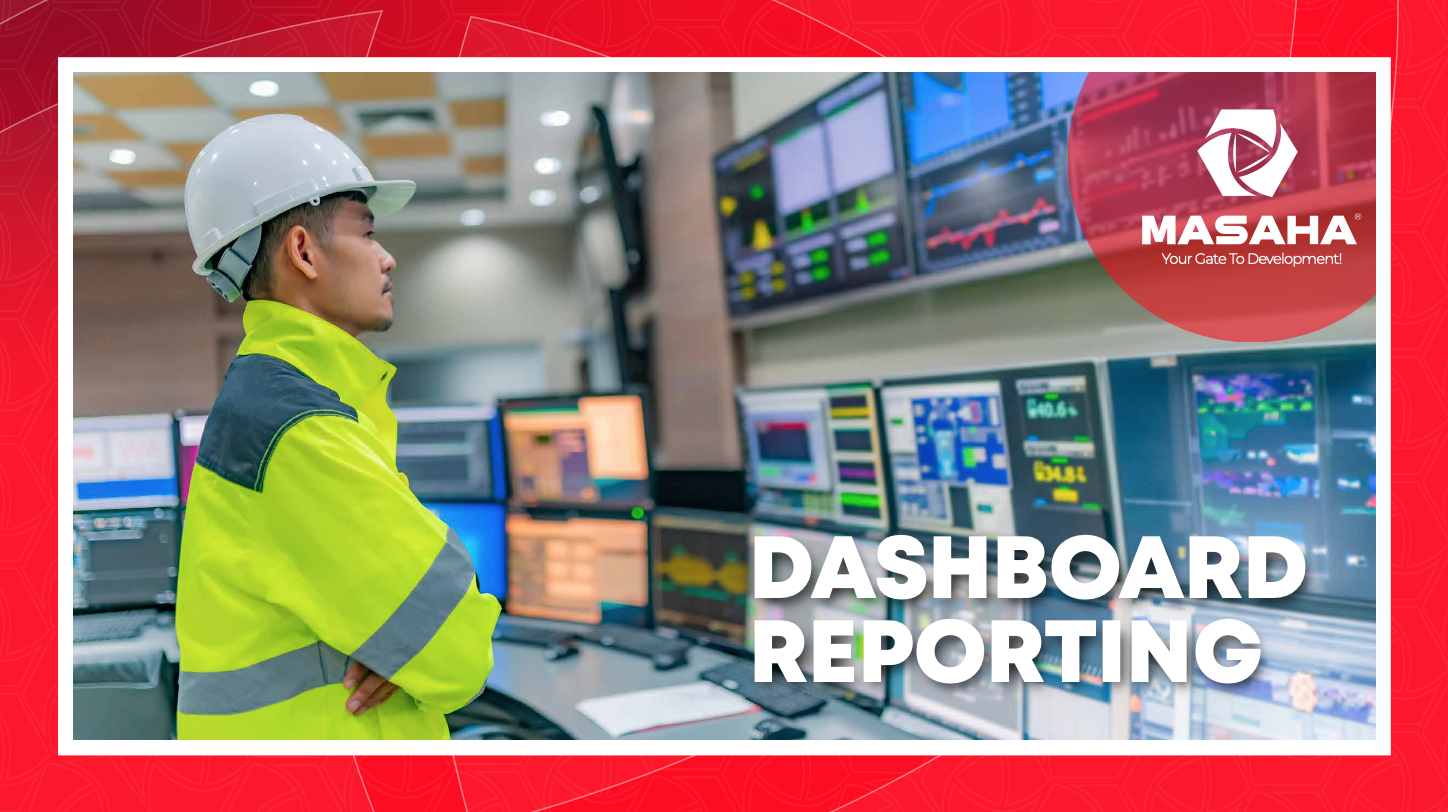
Developed a comprehensive TV Dashboard system that enables faster, data-driven decisions at all levels - management, operational, and frontline. The solution provides real-time tracking of revenue, expenses, profitability, fleet utilization, project progress, inventory, and departmental KPIs. Each department dashboard is customized with relevant metrics while maintaining a consistent visual language and data structure that makes information more accessible and actionable across the organization.
Process
Requirements Analysis - Identified critical KPIs for each of 12 departments (Executive, Rental, Sales, Power Systems, Projects, Spare Parts, Service, HR, Finance, Procurement, Logistics, Operations & HSE)
Dashboard Architecture - Designed unified TV dashboard system for real-time monitoring across all business levels
KPI Definition - Defined department-specific metrics including fleet utilization, revenue tracking, inventory turnover, project progress, manpower allocation, and operational efficiency
Data Visualization - Created intuitive visual representations for complex metrics including charts, graphs, and progress indicators
Integration Planning - Established data connectivity for live monitoring of revenue, expenses, profitability, overdue payments, and operational risks
Department Customization - Tailored each dashboard (Rental, Sales, Projects, HR, Finance, etc.) with relevant KPIs while maintaining consistency
Testing & Validation - Verified real-time data accuracy and dashboard responsiveness with stakeholders from each department
Implementation Guide - Documented KPI examples and customization options for each department dashboard
Results
Successfully deployed a comprehensive dashboard system covering 12 departments that improved organizational performance through better cost control, target setting, and quality metrics. The solution increased transparency across all business functions, enabled faster reaction time to operational risks, improved performance monitoring, and drove department alignment through a unified source of information. Key benefits include real-time visibility into fleet utilization, project progress, inventory management, financial metrics, and operational KPIs, ultimately resulting in better business performance and increased profitability.
Tools & Technologies
The dashboard system has transformed how we monitor and manage our business operations. Having real-time visibility across all 12 departments allows us to make faster, more informed decisions and quickly identify areas that need attention.
Operations Director
Masaha Global